Line chart
The line chart shows the score for both teams over time. Only points that increase the score for any team are included in the chart. The x-axis holds the point count. The y-axis shows the score for both teams. In the example below the set ended with a score of 10:21. Team A (blue color) had 10 points and team B (orange color) had 21 points.
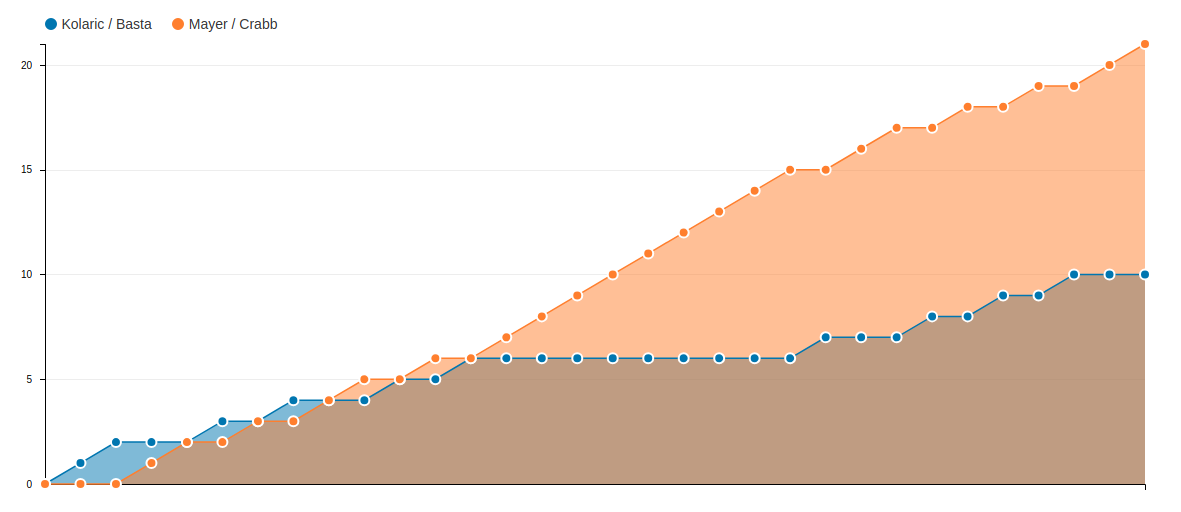
The line chart makes it easy to spot when the two teams where close together. You are able to see when one team was on fire and scored multiple times. Use your mouse and move over the chart to get additional information about a single move.
Use the dropdown to switch between the sets of a match.