Zones
The zones view show all information regarding start zone and end zone for a single match.
On the left side are the values for the start zone. On the right side are the value for the end zone.
In the middle is a heatmap visualizing the data from the tables on the sides. At the bottom of the visualization is the start zone and at the top the end zone. The start zone uses and orange color whereas the end zone uses a blue color. The darker the color for a particular zone the more moves are connected to it.

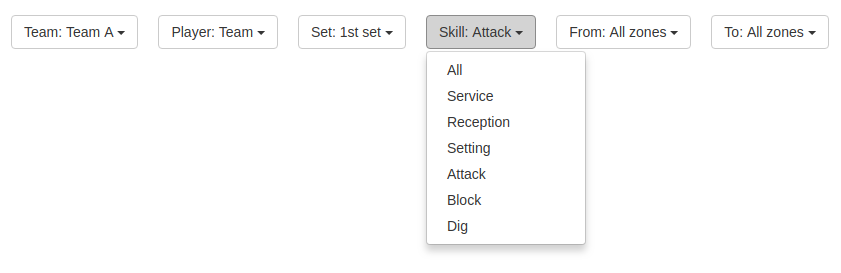
Powerful filters give you the flexibility to analyze any combination you like. Filter by teams, players, sets, skills, or any of the nine start and end zones.